How Accurate is the Grid Method For Calculating Earthworks Cut & Fill Volumes?
For those who are not using software to estimate earthworks volumes, the Grid Method is by far the most popular of the manual methods. We are sometimes asked about the accuracy of this method. It’s not easy to give a short answer to this question, because it varies greatly based on a number of factors. In this post we try to provide an answer, and give some practical guidance to those that are using this method to estimate earthworks quantities.
THE GRID METHOD
The grid method involves drawing a uniform grid onto a plan of the earthworks project, and taking off the existing and proposed ground levels at each node of the grid. With these values the average depth of cut or fill required on each cell of the grid is calculated, and the volume for each cell is obtained by multiplying the depth by the cell area. By adding the volumes for each cell together the total cut and fill volumes for the project can be estimated.
We have discussed the grid method in detail, as well as the alternative cross-section method in a previous post. If you are not familiar with this method we recommend you read the post linked at the bottom of this page before continuing to read.
The average cut or fill depths are determined for each cell in the grid. From these depths the volumes of each grid cell can be calculated, and by adding the cell volumes together the total cut and fill volumes are obtained
RESOLUTION OF THE GRID
The most obvious factor that will influence the accuracy of the grid method is the size of the grid squares that are used. The smaller squares that are used, the more accurate the method would be expected to be. However, this is a manual method, and the number of grid squares also has a huge impact on the amount of time it takes to generate the estimate. There is therefore a balance that must be struck between accuracy and speed.
This is one of the factors that makes it difficult to answer the question of how accurate the method is, since it’s highly dependent on the density of the grid.
In order to provide some guidance, we have performed calculations on a number of projects, and based on grids of various densities. This should enable us to see typical accuracies that may be achieved at different grid densities.
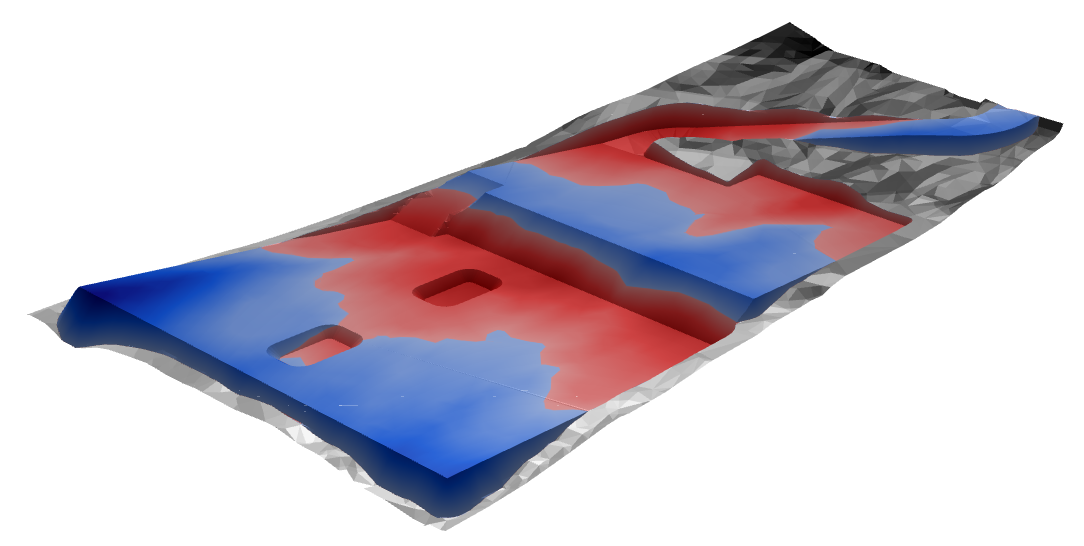
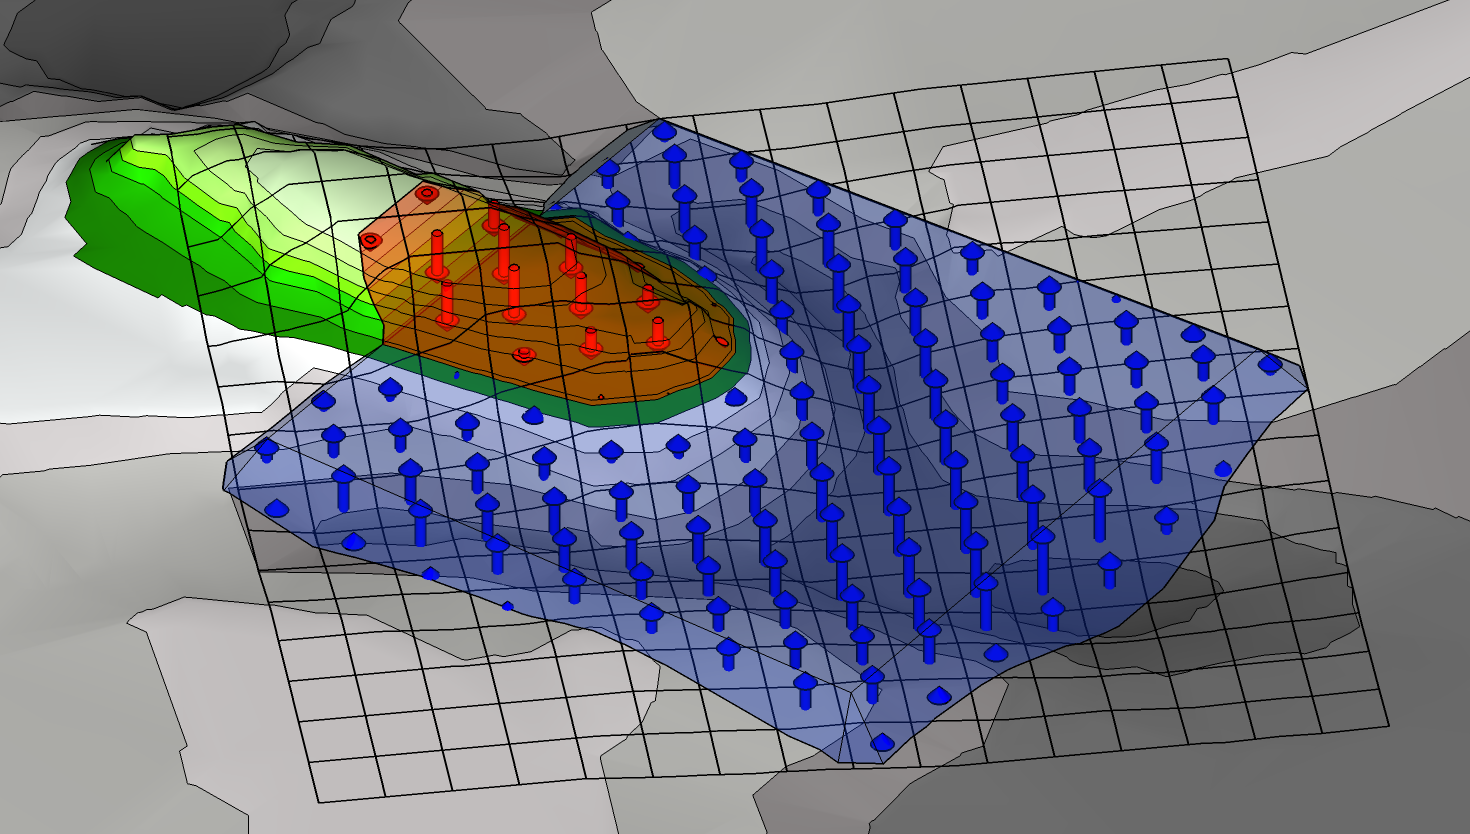
Example project.
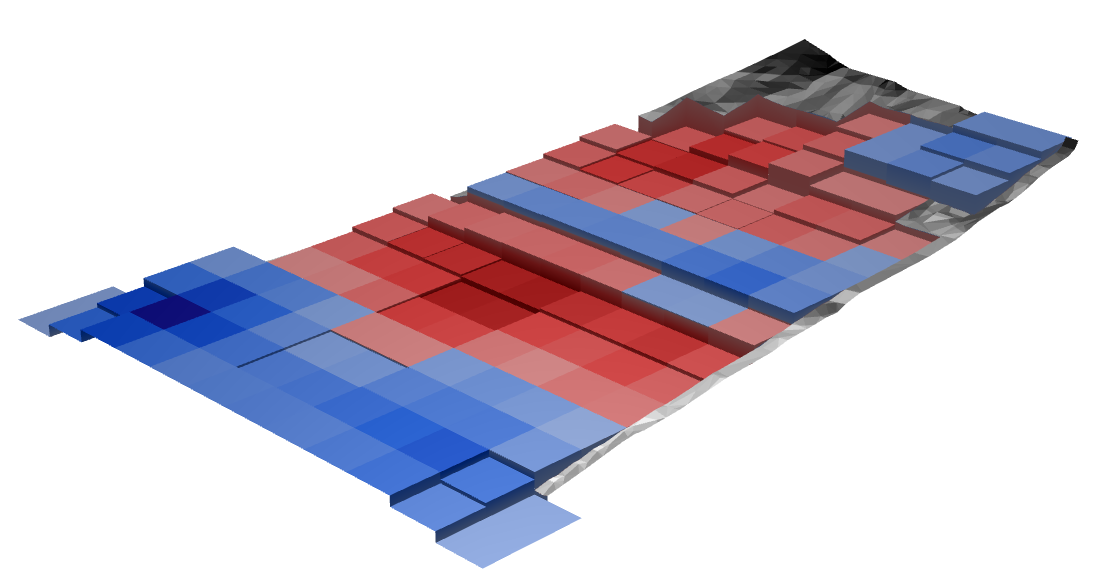
Example project gridded with 100 grid points inside the cut/fill area.
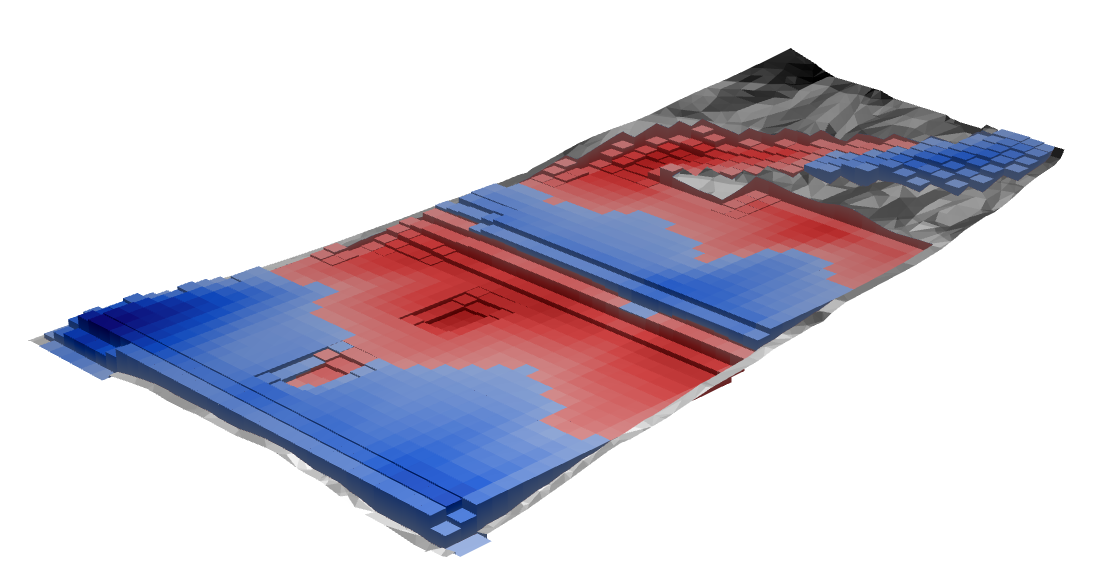
Example project gridded with 1000 grid points inside the cut/fill area
ACCURACY AT DIFFERENT GRID DENSITIES
The accuracy of the grid method at different grid densities have been compared on ten real-life project examples. These projects have been selected to represent a variety of project types, and vary greatly in project complexity.
The calculations based on the grids have each been compared to a calculation based on triangulated meshes. This method is mathematically exact, because it contains every facet of both the existing and proposed surfaces. However, it should be noted that this is a mathematical comparison only; it cannot and does not represent any inaccuracy that may occur due to surveying of the site, estimates of earth bulking, etc.
Three key parameters have been checked: The cut volume, the fill volumes and the net volume. The accuracy values given in the graph below represent the worst of these three values, expressed as a percentage of the total earthworks volume.
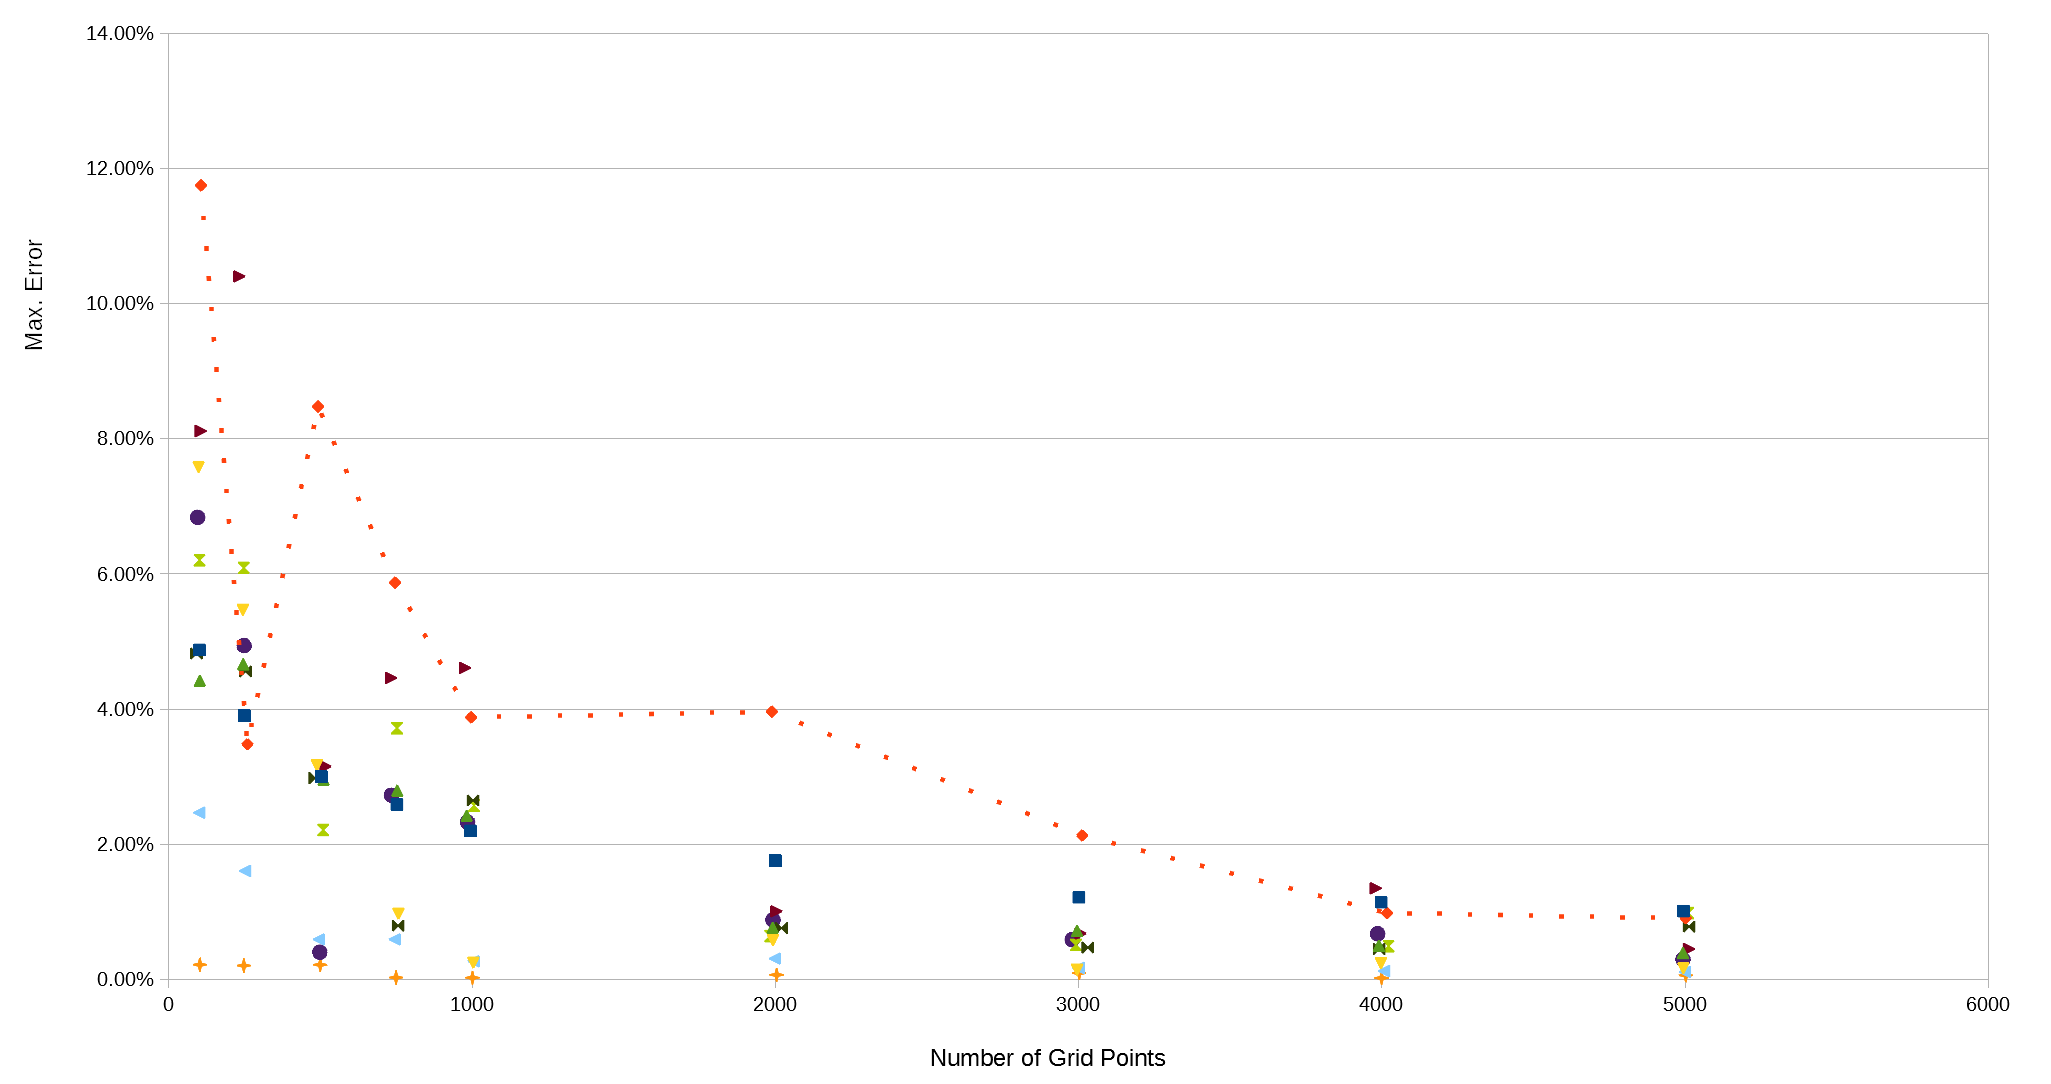
Comparison of estimate accuracy vs. grid density for 10 real-life projects. The number of points refers to the number of points landing within the earthworks region. The grids used were oriented horizontal-vertical. A line has been drawn on one of the projects to demonstrate how erratic the trend can be.
GRID ORIENTATION
The graph above showed some examples which were not only much less accurate than others, but also much less predictable. In other words, increasing the grid squares did not always improve the accuracy, although the general trend was always for it to improve as the grid density increased.
Inspection of these erratic examples revealed that they had something in common. They had retaining walls that ran vertically up the site boundary. Since the grids in the comparison above were orientated horizontally and vertically, this meant that the retaining walls aligned with the grid. This is not particularly unusual, since project drawings are often orientated to site boundaries and these often have retaining walls at the boundary.
It makes sense that this could cause the outcome to become unpredictable. Retaining walls naturally pose a challenge for the grid method, since the sharp change of levels can cause a grid square to be unrepresentative of the true terrain. For example, if 2 corners of a grid lie on one side of a wall, and two on the other, it may be that there is significant cut on one side of the wall, and significant fill on the other. However, since values are averaged over the grid square, the result will be little or no earthworks for this square.
The problem with the grid aligning with the wall is that rather than this happening for one grid square, the same issue can occur for a number of squares, magnifying this inaccuracy. Therefore the accuracy becomes highly dependent on how the grid points happen to land with respect to this feature.
In order to investigate this effect, the comparison was repeated, but orientating the grids for each project based on inspection of the projects. The grids were rotated to try to avoid alignment of the grid with the most significant project features, in terms of any steep changes in the ground levels.
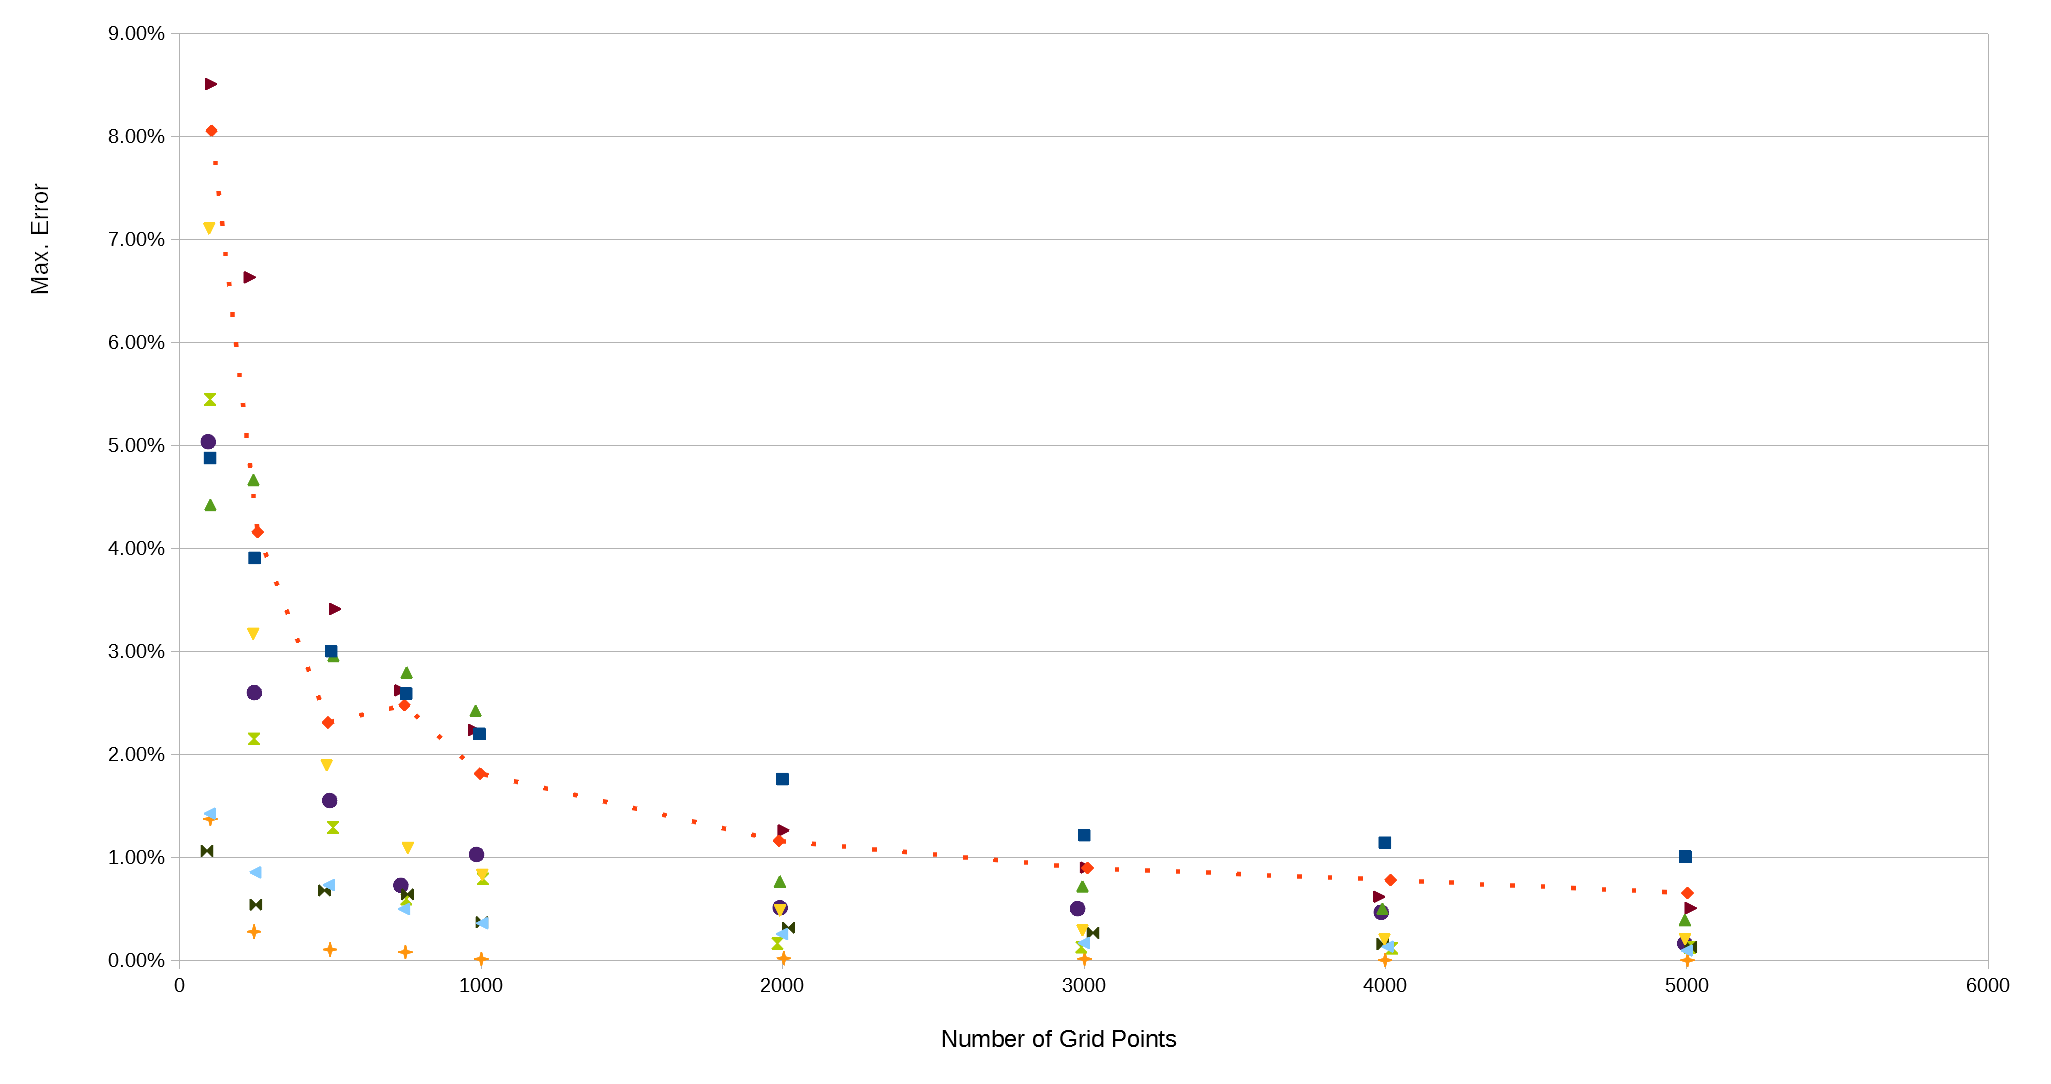
The same comparison repeated with the grids rotated to avoid alignment with major ground features. These results show an improvement in accuracy and predictability compared to the graph above.
CONCLUSION
Based on these project examples, we can draw the following conclusions:
- The grid orientation has a significant impact on accuracy and predictability. It should be oriented to avoid retaining walls and other steep changes in ground levels. Note that rotating the grid by 45° will not achieve this, as the points would still land in a consistent way with respect to the wall. For example, if there’s a major feature that runs vertically up the site, it may be appropriate to align the grid at 30° to horizontal;
- If oriented this way, you can expect to achieve accuracies within 5% with a few hundred grid squares inside the earthworks region. In all examples considered, 5% accuracy was reached at 500 grid squares, and in most examples it was achieved with 250 squares;
- Even with the grids orientated to avoid major features, there is significant variability in the accuracy between projects. Inspection of the projects suggests that those with stepped ground profiles are the hardest to resolve accurately with this method, whereas those with smooth profiles are easier. This is logical, given that the grid method has an averaging effect which will smooth out the ground profile.
FURTHER RESOURCES
- There is a post which covers the manual methods of earthworks calculation here.
- Download the free Kubla Cubed Lite to try using software to calculate cut and fill volumes.
- Buy a Kubla Cubed Professional licence.
- Visit the wikipedia page which compares the different software for earthworks estimates here.
Recent Comments