Calculating Earthworks Cut & Fill With A Spreadsheet | Cross Section Method
Previously, in regard to earthworks estimation, we have written two articles on the Cross Section and Grid Methods. Read these in our Industry Articles library.
This article demonstrates how to calculate earthworks cut and filling using the Cross Section Method and a spreadsheet. Starting with pen and paper we will show you how to generate and input the cross section data to calculate the cut and fill volumes in the spreadsheet. (There is a separate blog which explains how to use the Grid Method sheet)
Download the spreadsheet to use with the tutorial.
CROSS SECTION METHOD – SUMMARY
The cross-section method is when you divide your site into equal parallel sections. Imagine slicing through the earth with a knife at regular intervals.
For each cross section the cut area and the fill area are calculated. Then for each cross section pair, the cut and fill volume of the section between them is approximated by finding the average of two adjacent sections and multiplying by the distance between them.
An example of a cross sections and sums done to calculate the volume is below:
The formula to calculate the volume between two sections:

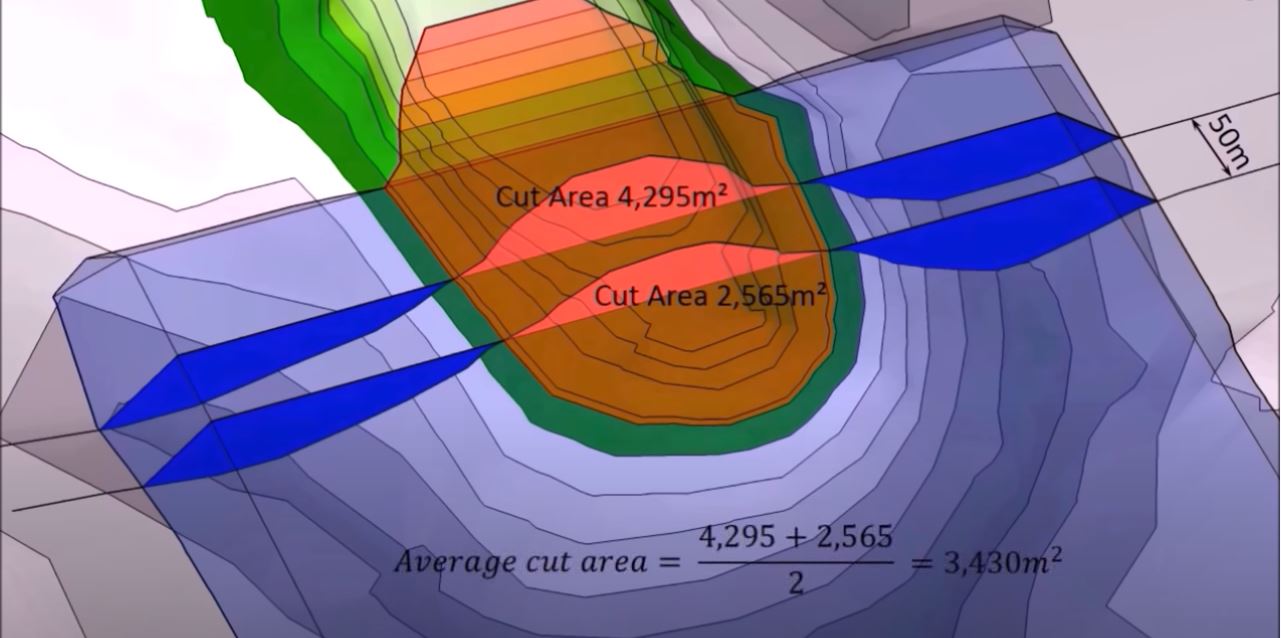
Average Cut Area = (4295 + 2565)/2 = 3430m sq
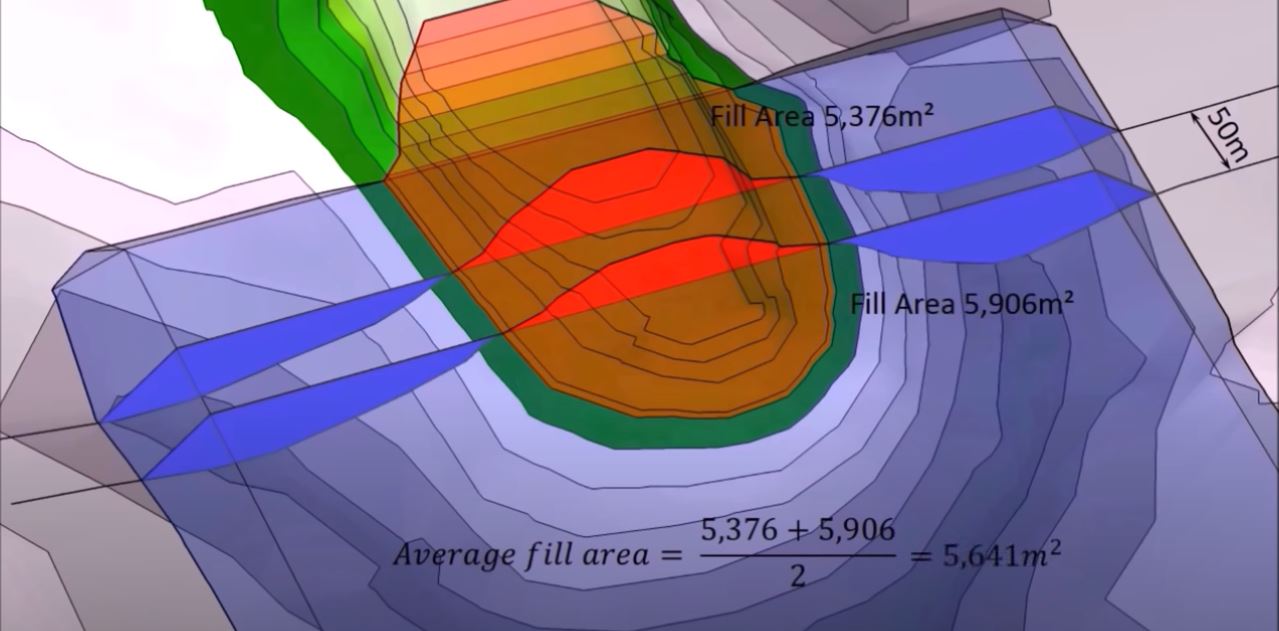
Average Fill Area = (5376 + 5906)/2 = 5641m sq
Distance Between Sections = 50m
Cut Volume = 3430 x 50 = 171,500m cu
Fill Volume = 5641 x 50 = 282,050m cu
For the whole site, the total volume is determined by adding all the pairs of cut volumes and the fill volumes together.
USING A SPREADSHEET
As there are so many calculations to complete, another method is using a spreadsheet, such as the one we have provided.
The spreadsheet :
a) Creates a graph showing the profile of the Existing and Proposed for each section. This shows the existing levels in blue and proposed in orange.
b) Calculates the cut and fill area for each section. Shown next to the profile graph.
c) Calculates the overall total Cut, Fill and Net Volume. Shown in the Results table.
But first you will need to have your site plan ready and take off the Existing (E) and Proposed (P) ground levels.
YOU WILL NEED :
• A printed copy of your site plan
• An extra fine pen or mechanical pencil
• (optional) Tracing paper/acetate
• The Kubla Spreadsheet
COLLECTING CROSS SECTION DATA
1. Print a copy of your site plan with the existing and proposed levels defined.
2. Check the scale and units of your site plan. You need to know the scale to calculate the length of you cross section, the distance between them and the distances along the cross section where the elevation changes. The photo opposite shows 4cm is the equivalent to 20m on the plan.
3. Draw your cross section lines. You can either hand draw it to match your requirements or draw in CAD.
Whichever method you decide, you do need to number the lines; 1-… however many you have. The spreadsheet has a maximum of 25 lines for you to enter data into.
This example plan is in metric units (centimetres (cm) so we have used 2cm = 10m. When you are deciding the distance between each section, it is important to consider that the shorter the distance, the more sections and data you will collect. Therefore, the more accurate your end results and estimations will be.


4. Collect your data. You now need to take off the existing (E) and proposed (P) levels and write them next to each significant change in elevation, to produce a cross section. An example, showing one way to do this, is in the photo. It is key to use your fine pen or pencil here to ensure you can fit in the two levels and so they remain legible.
In this example, the levels have been defined using contour lines.
i) For each contour make a mark on your section and write the level.
I have used two colours to make the mark; black for existing and written the level above the section line and pink for the proposed and the level is written below the line. This makes it clear for when you are entering the levels into the spreadsheet.
ii) The start of the section is 0 distance and then you measure from 0 along the line to get the distance for the change in elevation. The distances for the changes for the existing may well be different to the proposed.
You can use a ruler to measure the distance in cm/mm/inches and then multiple by x to scale it. Alternatively, you can use a scale ruler with a compatible level which means you don’t need to complete that sum – really handy!

TOP TIPS :
1. Use a fine line pen or mechanical pencil so that your figures for each level change remain legible in the small space that you have available to you.
2. Use a roller ruler to draw parallel lines at set distances
3. Use a scale ruler, with a compatible scale
INPUTTING DATA INTO THE SPREADSHEET
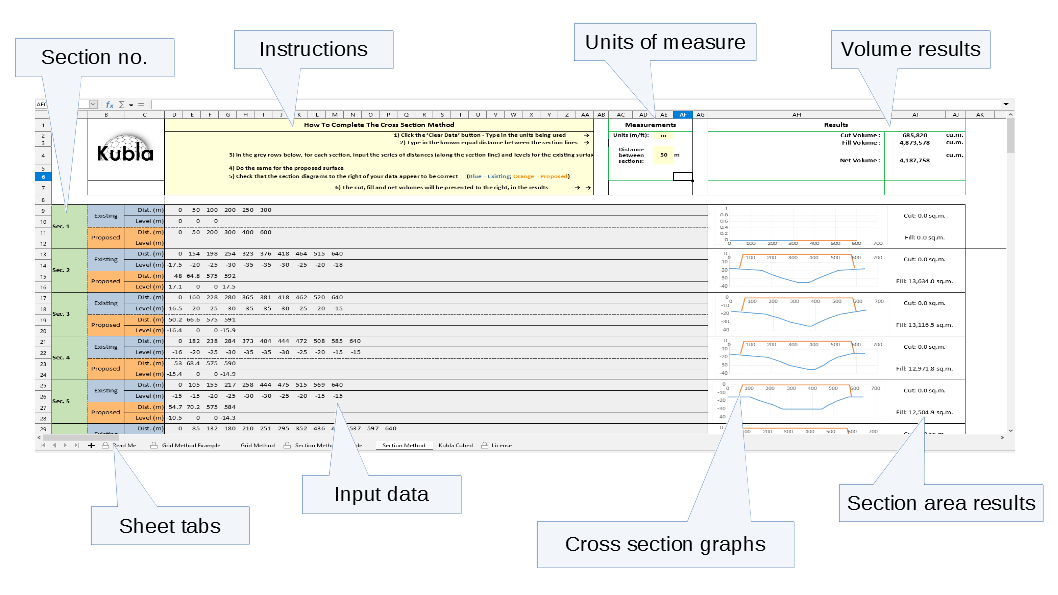
1. Open the spreadsheet and select the “Section Method Example” tab so that you have the sheet on screen.
You will notice that this sheet is protected and cannot be amended. Before starting your own sheet, we recommend you view this example to understand what your finished cross section results should look like.
2. Open the second tab called, “Section Method”. This one you can edit and enter your data into. (Please refer to the licence tab for modifying and redistributing terms.)
3. Enter your units of measure and the distance between each section
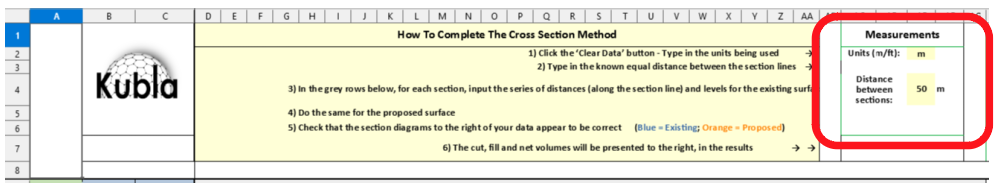
Without this completed, the calculations will not generate.
4. For each section, add your data.
i) Input your cross section data from the Existing and Proposed sections
ii) As you do this the cross section graphs and results table will update. You will be able to see any anomalies/errors as you enter the data- it’s vital to check that these visuals are as you expect.
iii) Once all data has been entered, you will have the Cut, Fill and Net Volumes calculated next to each section and as a Total in the results.


5. Read your Results and make your estimations. Once all data has been entered, you will have the Cut, Fill Volumes calculated in each section and the Total volumes net volume for the entire grids.
You can now use this data to estimate the cost of your project.
TOP TIPS :
1. Check every section for data entry mistakes
2. The graphs will highlight an major anomalies
USING KUBLA CUBED TO ESTIMATE EARTHWORKS CUT & FILL
Although the Grid Method spreadsheet does speed up the calculation process, the possibility of human error when inputting the data remains. The alternative to using the spreadsheet is to allow TIN prism software to complete the calculations for you.
Kubla Cubed calculates cut and fill volumes using TIN (Triangular Irregular Networks), which will calculate to a higher degree of accuracy than the 2D grid or cross section methods, and in less time.
Click below to find out more and download a free version of Kubla Cubed (Lite)

FURTHER RESOURCES
- Check out more articles in our Library.
- Download the free Kubla Cubed Lite to try out using software to calculate cut and fill volumes.
- Buy a Kubla Cubed Professional licence.
- Visit the wikipedia page which compares the different software for earthworks estimates.