Calculating Earthworks Cut & Fill With A Spreadsheet | Grid Method
There are many ways to estimate earthworks cut & fill, three popular approaches are discussed in a separate article here. Two of the methods discussed can be completed without the use of software: the grid method and the cross section method. This article demonstrates how to calculate earthworks cut and filling using the grid method (there is a separate blog which explains how to use the cross section method). Using only pen and paper and a free spreadsheet, we will show you how to record and input the data update the spreadsheet to calculate earthworks cut and fill volumes.
To start, you will need download this spreadsheet :
Grid Method Overview
The grid method allows you to estimate the cut and fill volumes of an earthworks project by rationalising the site into a grid of cells. Cut and fill for each cell can be calculated separately and then each fill cell can be added together and each cut cell, to get the total cut and fill.
Each grid cell volume is estimated using the formula:
Vi = Ai * (P – E)
The volume (V) of a grid cell (i) equals the area (A) of the cell multiplied by the difference between the average existing ground (E) and the average proposed ground (P) levels.
E = The average of the existing elevation at the four corners of the cell.
P = The average of the proposed elevation at the four corners of the cell.
(P – E) = The difference between the existing and the proposed
Multiply by the area (A) of the grid cell (i)
Then all the cells that have negative difference (cut) are added together to find the total cut volume and all the sells with a positive difference (fill) are added together to find the total fill volume.
To find the Net Volume, the total Cut is subtracted from the total Fill to find the difference for the whole site.

Vi = Ai * (P – E)
The volume (V) of a grid cell (i) equals the area (A) of a cell, multiplied by the difference between the existing ground (E) and the proposed ground (P) levels.
What the Spreadsheet Does
As the above formula will need to be repeated 10’s if not 100’s of times to get an estimate it is a good idea to use a spreadsheet for the calculations.
The spreadsheet :
- Calculates the difference between E and P for each vertex. This is written in grey in each defined cell.
- Shades the cell. When the difference is a positive number it turns Blue for Fill and when it is negative it turns Red for Cut.
- Calculates average Cut/Fill of every 4 vertices. This is shown in the second grid, that you can view when you scroll across to the right of the sheet. WARNING: Do not edit this second grid, it may remove the formulae needed to generate the calculations.
- Calculates the overall total Cut, Fill and Net Volume. These are shown in the Results table.
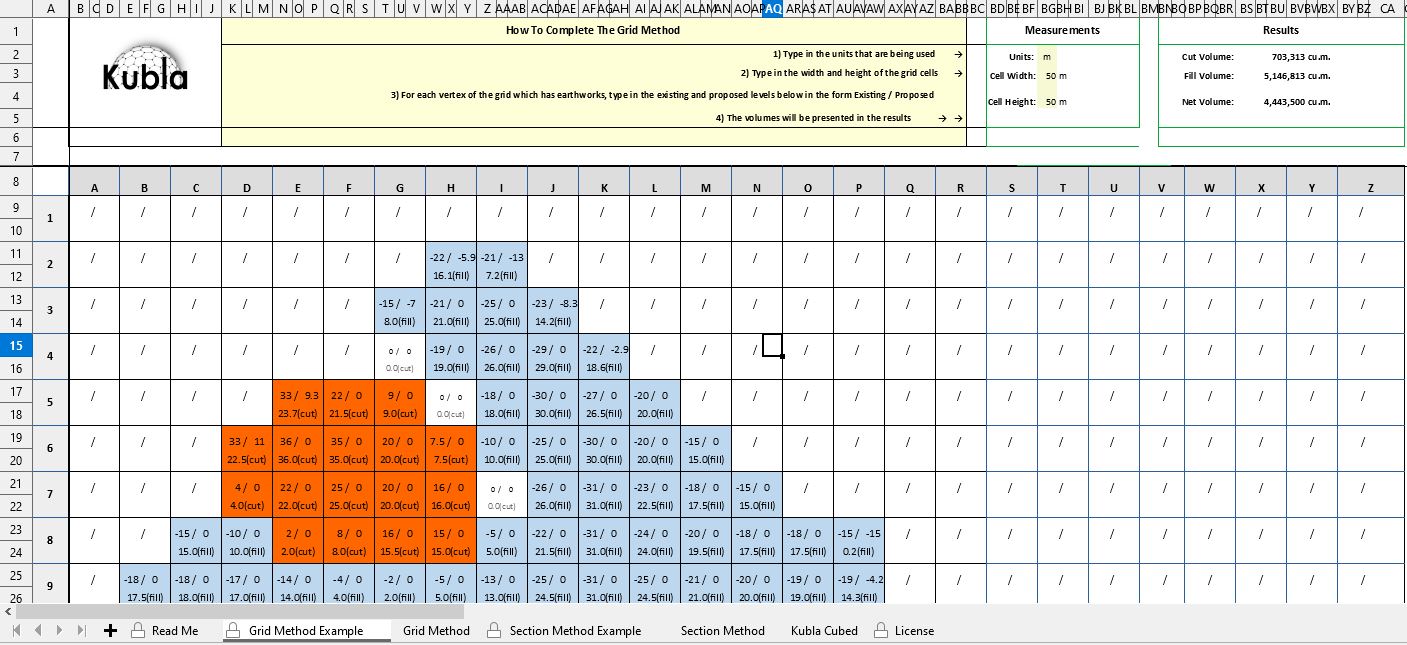
So the spreadsheet will do the bulk of the calculations but first we need to establish a grid on our site plan and take off the Existing (E) and Proposed (P) elevations.
CAD Software : The below highlights how to collect elevation data using pen and paper, you can also follow the same process using CAD software.
Recording the Grid Data
YOU WILL NEED
• A printed copy of your site plan
• An extra fine pen or mechanical pencil
• (optional) Tracing paper/acetate
• The Kubla Grid Method Spreadsheet
1. Print the Site Plan : Print a copy of the site plan ensure it has existing and proposed levels defined. These are known as ‘grading plans’
2. Decide on the units and scale of your Grid Squares : My plan is in metric units so I have used centimetres (cm) for the grid. It should be written on the plan what scale it is. You need to decide how large you want each grid cell to be and then calculate using the scale the dimensions of the grid squares in paper space. For instance if the plan is 1:200 and you want grid squares of 0.5m in the real world then your grid squares will need to be 2.5cm in paper space as 2.5cm x 200 = 500cm (0.5m).
When you are deciding the size of your grid squares, it is important to consider the trade off between dense grids that are more accurate but are potentially very time consuming to complete and larger grids that are less accurate and faster. This topic is discussed in more detail in the article : How Accurate is the Grid Method For Calculating Earthworks Cut & Fill Volumes?
3. Draw the grid : Once you have established the size of each cell you need to draw a grid over your whole site. A roller ruler can be a handy tool for this but a standard ruler works just fine also.
Rather than drawing a grid directly over the site plan it is a good idea to do it over an semi transparent sheet like acetate. This way you can make mistakes and don’t have to print another site plan. Another options is to print the grid by downloading a template offline.
4. Label the Grid Lines : You also need to label the X axis lines (not the cells) from A – Z and the Y axis lines from 1 ..2…3 so the cells correlate to cells in the spreadsheet we are using to do the calculations.
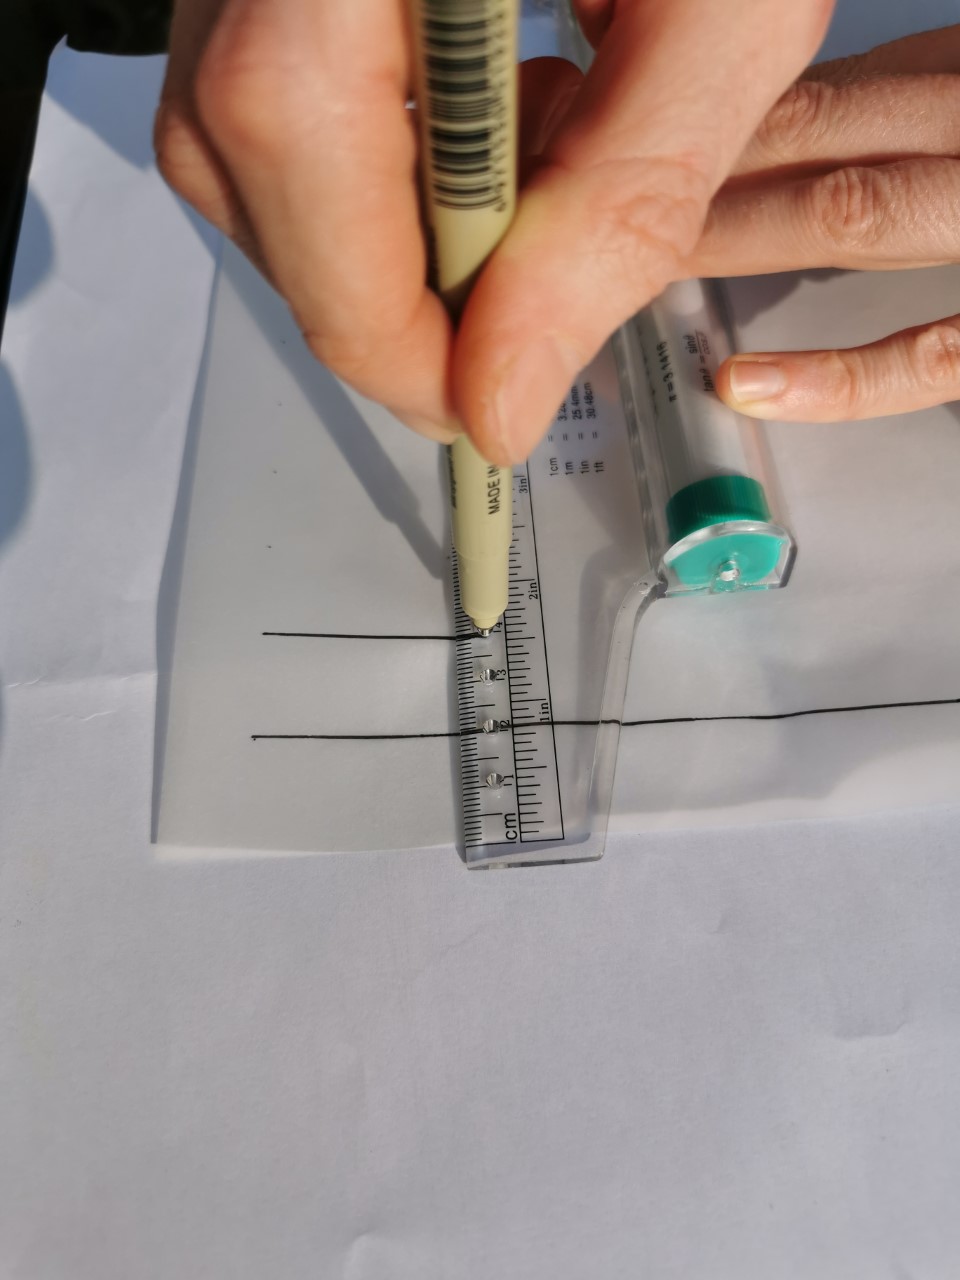
TOP TIP: Incompetech is a great site for creating grids of any dimensions, that you can download as a PDF and print.
When printing, be sure to have your tracing paper lined up securely to avoid it sliding off at an angle and printing slanted grid lines (this happened to me on my first attempt).
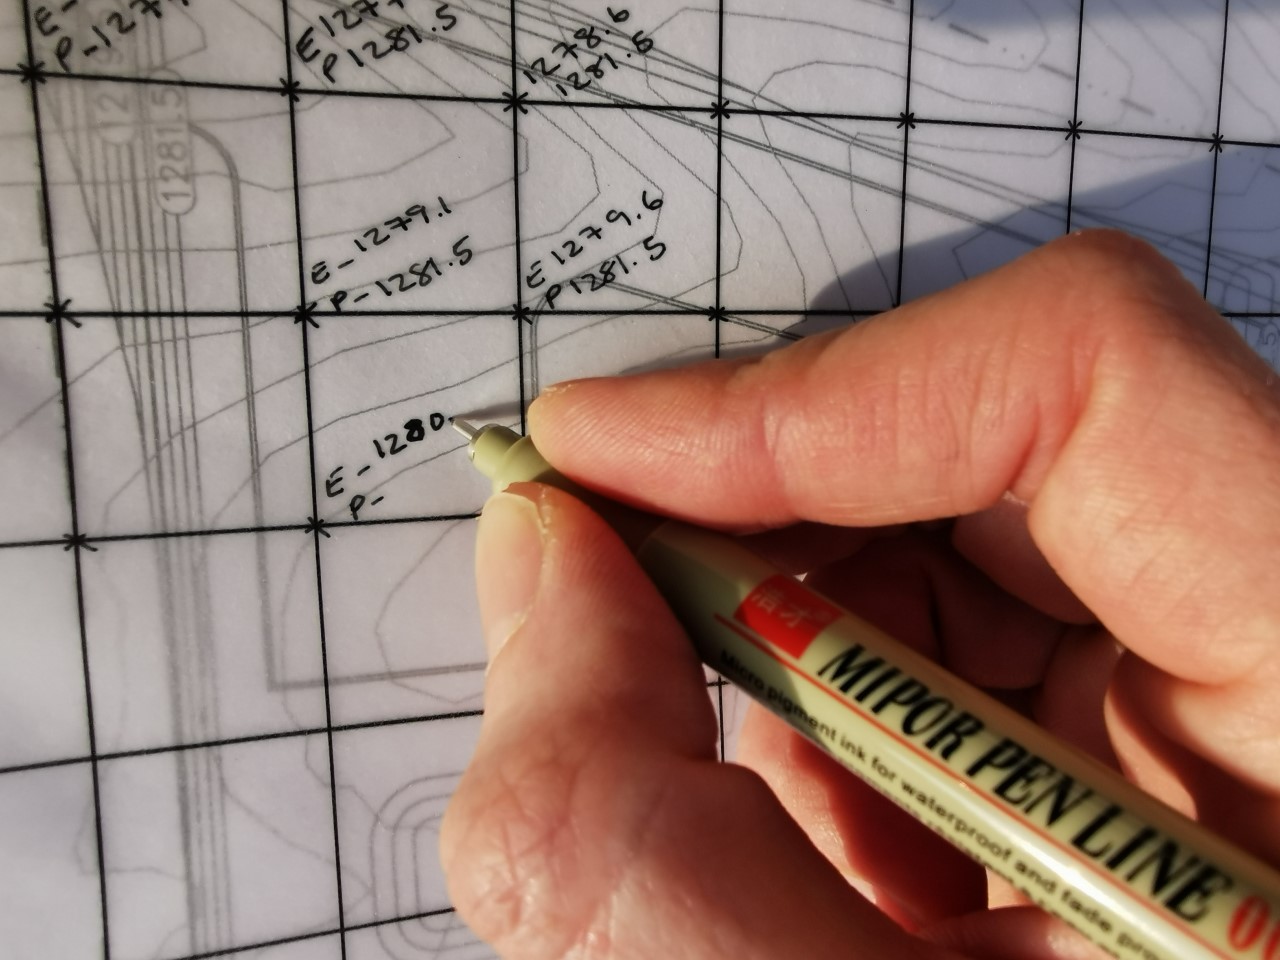
5. Record the elevations . Once you have established a grid and have it overlaid on your site plan you need to take off the existing (E) and proposed (P) levels and write them next to each vertex for every grid square. An example, showing one way to do this, is in the photo. It is key to use your fine pen or pencil here to ensure you can fit in the two levels and so they remain legible.
In this example, the elevations are indicated on the plan using contour lines. You will find that plans usually have contours or points but sometimes other elevation features like building pads or slopes. As a result it will often be the case that there is not an exact elevation at the intersection lines of the grid cells. Therefore you have to extrapolate as best you can. For instance if a point lies between two contour lines you can just take the mid point between them. It is not always easy but it is an estimate after all, sometimes you have to use your knowledge of site visits and photos to guess elevations that aren’t always clearly marked at the grid intersection points.
Input the Data into the Spreadsheet
1. Open the spreadsheet and select the “Grid Method Example” tab so that you can see an example.
You will notice that this sheet is protected and cannot be amended. However, we recommend you review this sheet to understand what your finished grid should look like and refer back to it during your data input.
2. Open the second tab called, Grid Method. This one you can edit and enter your data into. (Please refer to the licence tab for modifying and redistributing terms.)
3. Enter your units of measure and the dimensions of your grid squares. Add the unit of measure (e.g meters, feet, yards) and the dimensions of grid cells in world space e.g. 1m x 1m

Without this completed, the calculations will not generate.
4. For each grid vertex, add your data.
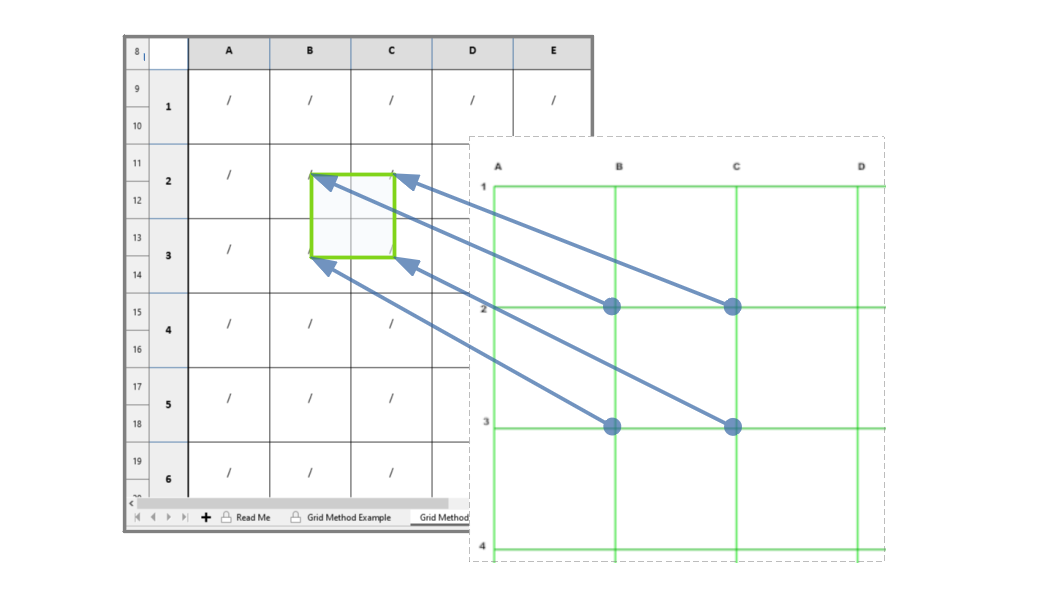
One cell on the spreadsheet represents one vertex on your grid. Each vertex on the grid should have existing and proposed elevations recorded and each cell can take two values in the format existing elevation / proposed elevation. A vertex is the intersection point between grid lines. Therefore, the vertex B2 on your grid cell B2 on the spreadsheet grid.
Below is a diagram to show where the data needs to be entered.
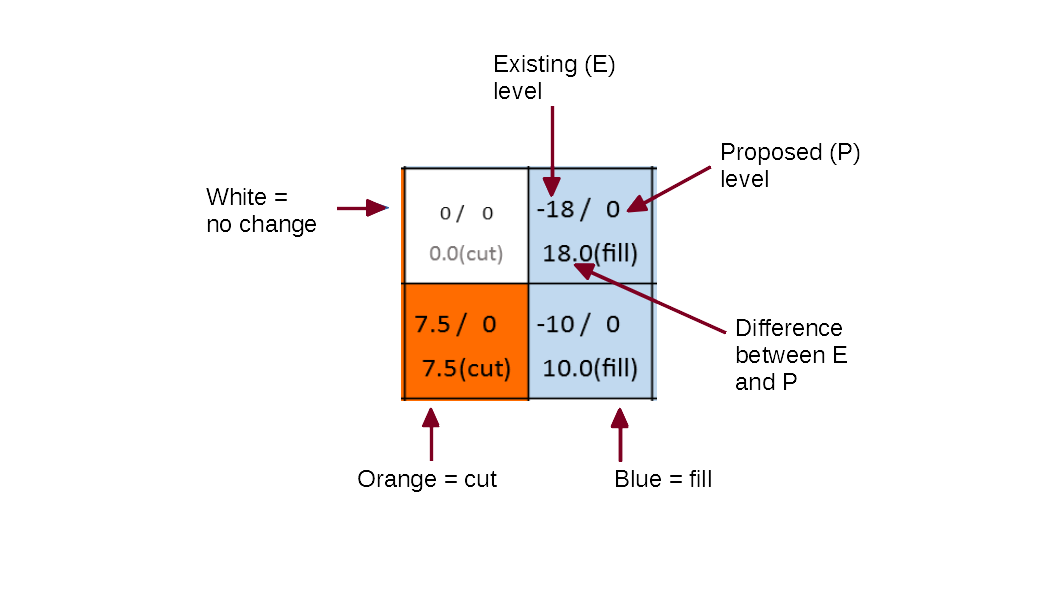
5. Read your Results and make your estimations. Once all data has been entered, you will have the Cut, Fill Volumes calculated in each grid cell and the Total volumes net volume for the entire grid. You can now use this data to estimate the cost of your project.
Advantages of Using Software
Although the Grid Method spreadsheet does speed up the calculation process, the possibility of human error during an exercise like this is high and the process is still very time consuming to get accurate results. There are many specialist software products that can calculate cut and fill and it is good to use them to either speed up the estimating time or for double checking your results.
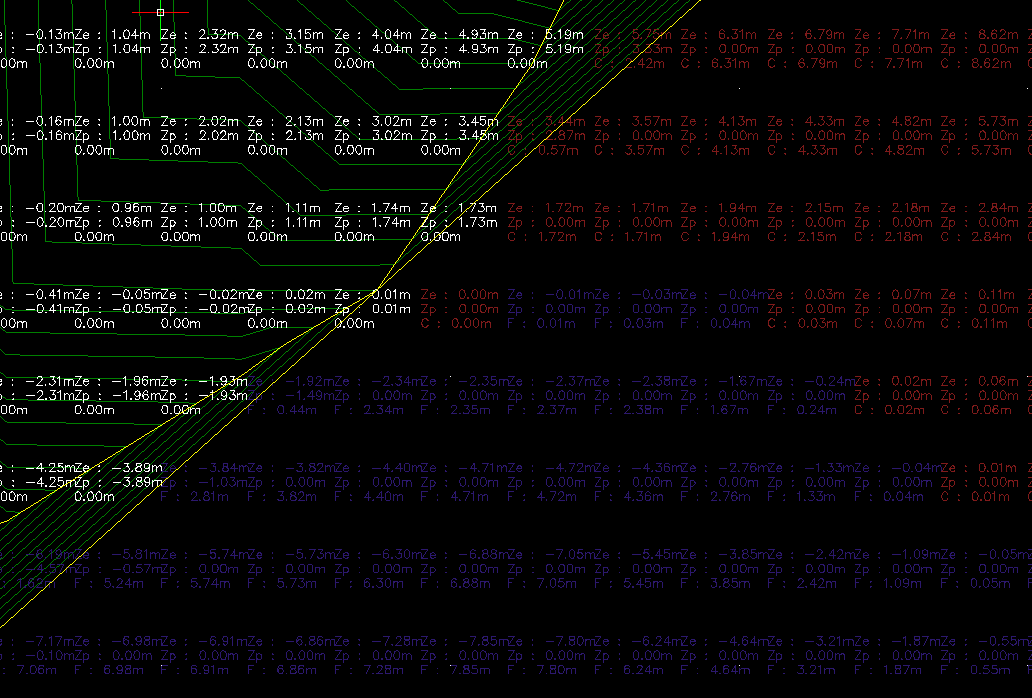
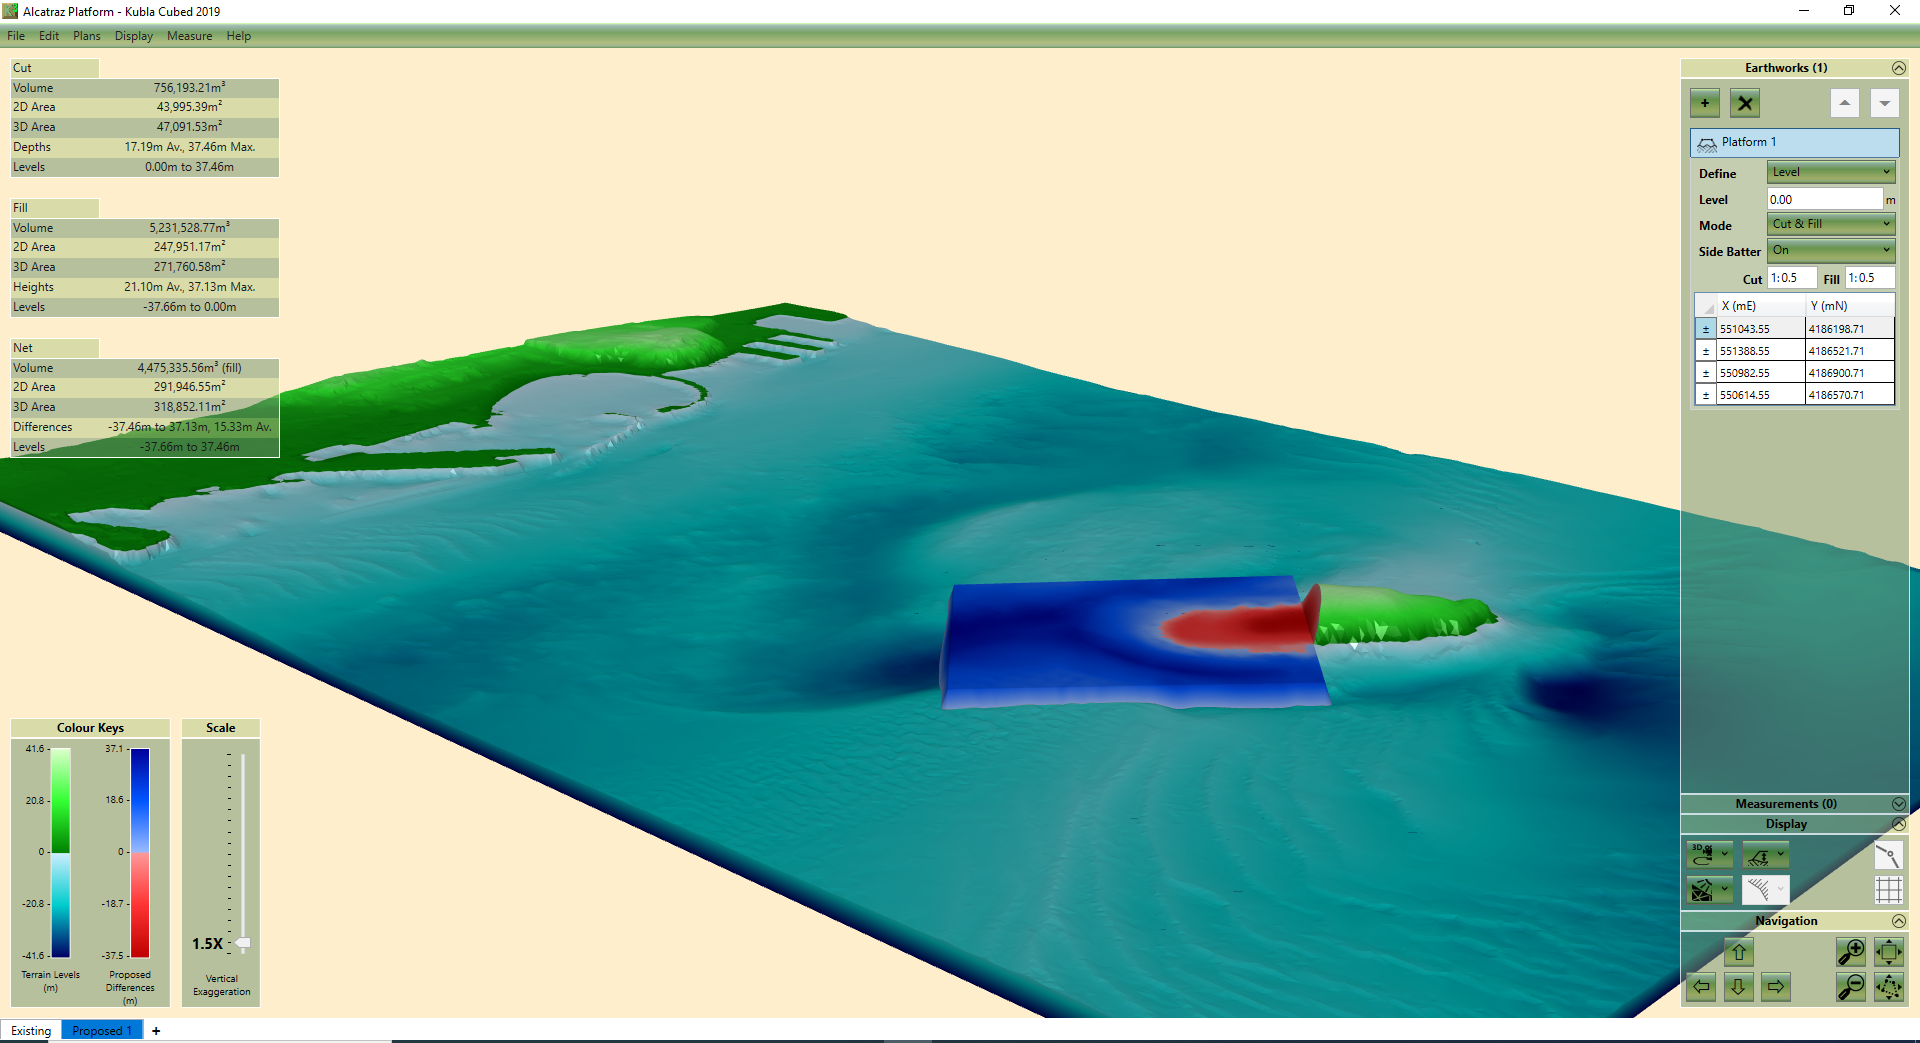
The software that we develop, Kubla Cubed, calculates cut and fill volumes using TIN (Triangular Irregular Networks), which will calculate to a higher degree of accuracy than the grid or cross section methods, and in less time.
Click below to find out more and download a free version of Kubla Cubed (Lite) which can be used to do cut\fill calculations when the proposed is made up of flat areas.
FURTHER RESOURCES
- Check out more articles in our library.
- Download the free Kubla Cubed Lite to try out using software to calculate cut and fill volumes.
- Buy a Kubla Cubed Professional licence.
- Visit the wikipedia page which compares the different software for earthworks estimates.
