The project data in Kubla Cubed can be presented as drawings, which can be saved either as PDF or to various CAD file formats. These drawings will include plan views of each phase you export, along with colour keys, earthworks quantity summary tables and transects if you have defined any.
To create a drawing, click on File, Create Drawing, and then PDF or CAD.
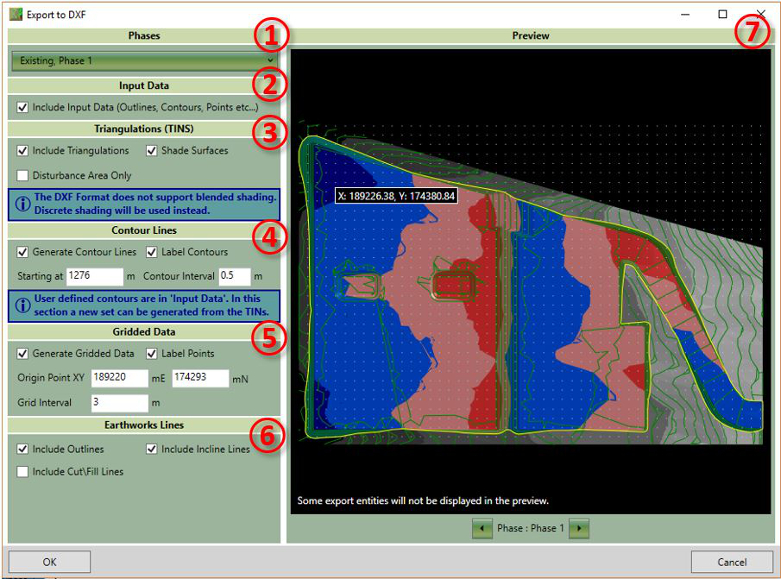
The available options on this form are described below:
- ① The Phases drop-down allows you to select which phases to include in the drawings. By default, only the selected phase and the existing phase are included. File layers are used to separate the entities by phase.
- ② Input Data: Select whether the drawings should include the user-input data (contours, points, boundaries etc.).
-
③ Triangulations: Select whether to include the
TINS in the drawings. Often, the TINS are not required if you are just interested in a
contour line or gridded data visualisation.
- Disturbance Area Only In some scenarios when exporting proposed surfaces, you may not want the undisturbed ground in the drawings.
-
④ Contour Lines: Choose to generate surface
contour lines. Note that contour lines used to define 'Feature Surfaces' in Kubla
Cubed will be included if 'Input Data' is checked. These are not the contour lines
referred to in this section. The contour lines in this section are an entirely new set that
are generated from the entire proposed surface.
- Label Contours: You can choose to turn off the labeling of contour lines.
- Starting At: In this box, set the level the contour lines start. It is advised to start on a round number. The default will be set to the bottom of the surface rounded down.
- Contour Interval: In this box, set the interval distance between each contour line. Very small contour intervals can cause large export times and large file sizes.
-
⑤ As well as generating contour lines from the
TINS, you can also include gridded data. This feature can be used to create a cut\fill plan
for site engineers or present results to those accustomed to using the grid method for
calculations.
- Label Points: Choose to turn off the labelling of points as it saves space in the file. It is recommended you keep this on, as the points will have litle meaning otherwise.
- Origin Point: Set the location of the origin point. The grid will extend out from here in all directions until it exceeds the extents of the surface. It is recommended to use rounded numbers. By default, it is set to the bottom left, rounded to a whole number.
- Grid Interval: In this box you can set the distance between each grid point. Very small grid intervals can cause large drawing generation times and large file sizes.
-
⑥ Earthworks linework created by Kubla
Cubed can also be included in the drawings.
- Outlines: The outlines of the earthworks can be included, which can be useful for knowing the location of designed features such as building pads, roads, ponds etc.
- Incline Lines: Kubla Cubed generates 'incline lines' to mark the generated side slopes joining earthworks elements to the ground. You can choose to include these in the drawings.
- Cut\Fill Lines: The lines can be exported in red and blue, showing the earthworks cut\fill boundaries.
- ⑦ Use the preview to get an indication of the drawing file's content. It is especially useful for previewing the density of the generated gridded data and generated contour lines. Note that this is only a preview, and your drawings will not appear exactly as presented here. When multiple phases are selected, you can cycle through them for preview using controls at the bottom of the preview panel. Multiple phases are not previewed all together to avoid confusion.
Once the drawing settings have been finalised, click OK. You will be prompted to choose the location to save your drawings.